
L-1 Visa in 2026: Issuance Data, Country Breakdown, and What It Means
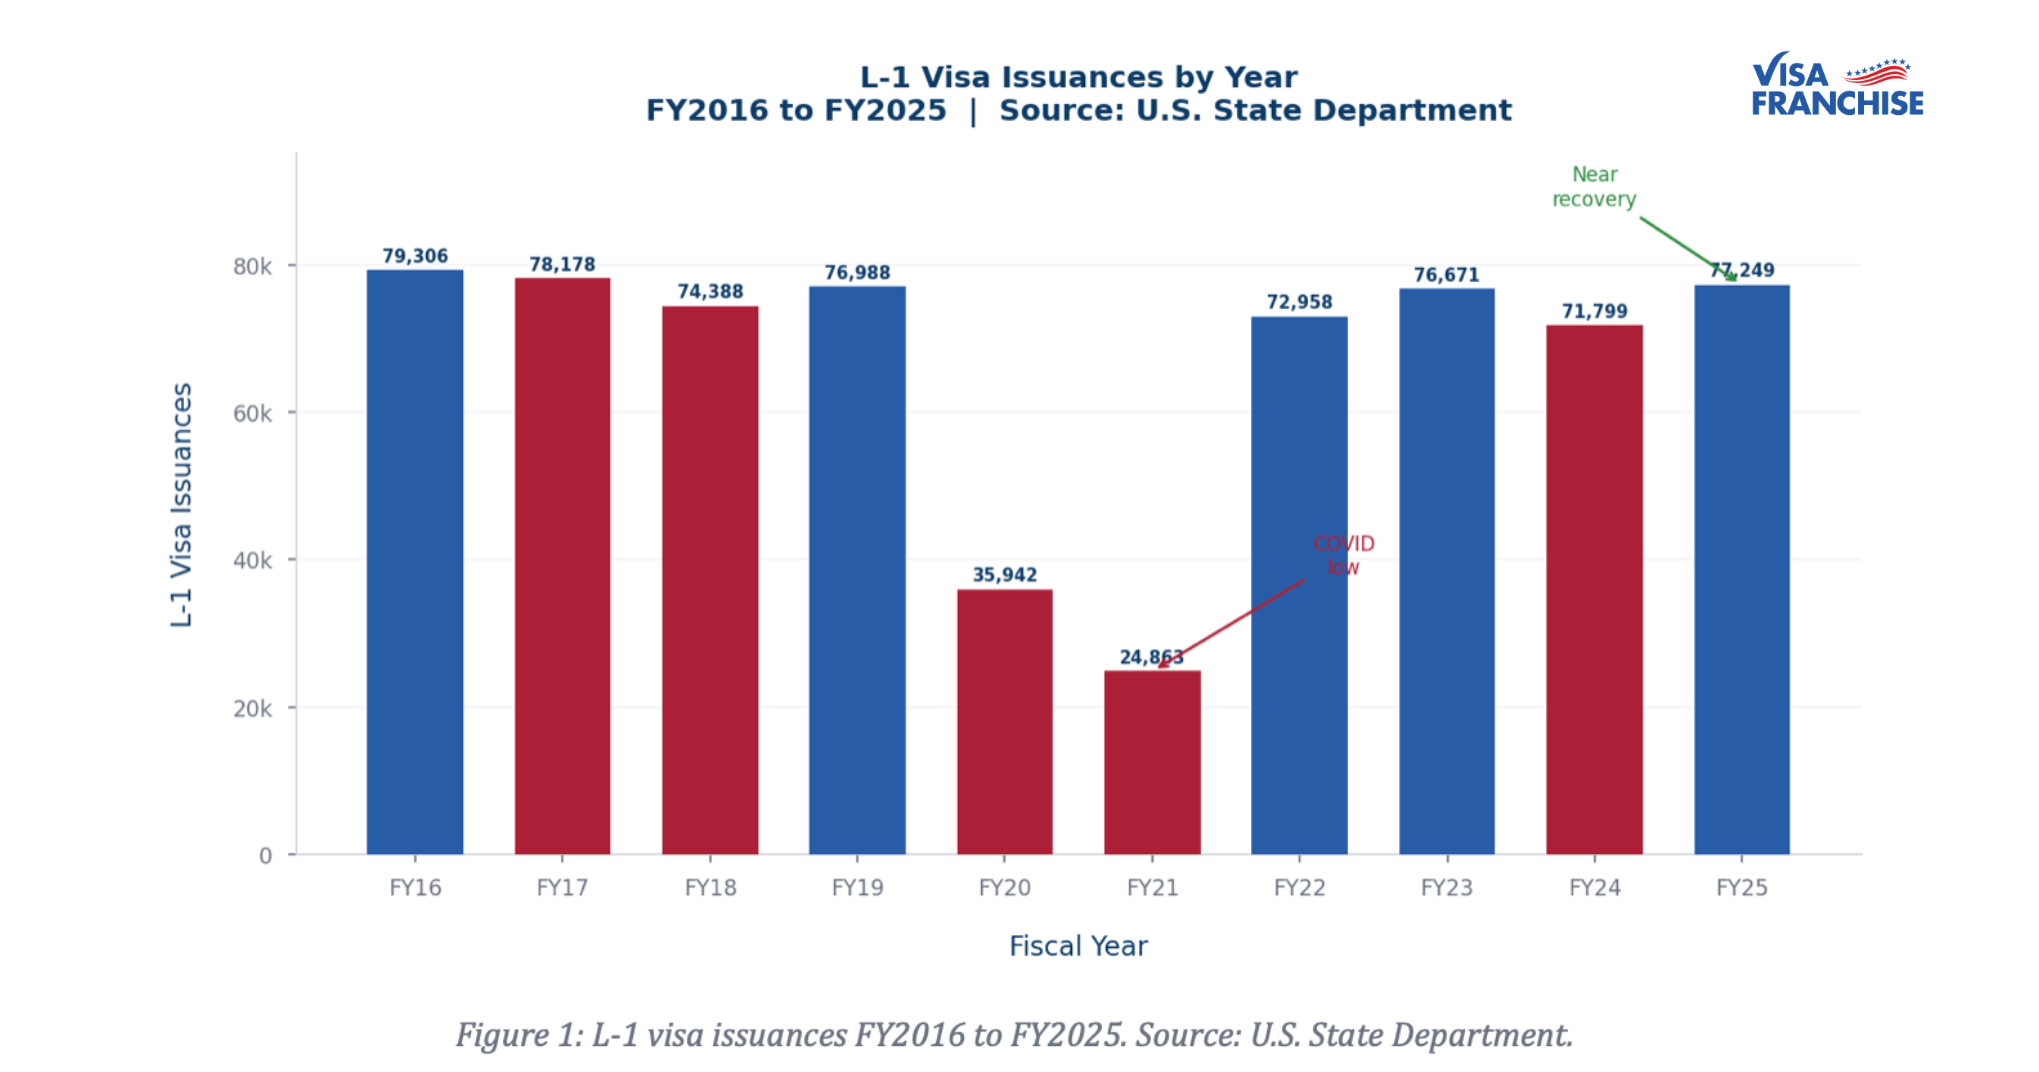
The State Department publish edits FY2025 nonimmigrant visa statistics in full. For the L-1 intracompany transfer visa, the headline number is 77,249 total issuances, up 7.6% from FY2024 and nearly back to the pre-pandemic level of 79,306 set in FY2016.
That recovery story is worth reading carefully. The L-1 program was hit harder by COVID than any of the other major work visa categories. From FY2019 to FY2021, issuances collapsed 67.7%, dropping from 76,988 to 24,863. The recovery has been steady but uneven, and the nationality mix in FY2025 looks different from what it was a decade ago.
This article breaks down the full FY2016 to FY2025 dataset, covers the country-by-country shifts, and explains what the numbers actually mean for multinational companies and employees planning an L-1 transfer.
FY2025 L-1 Visa Numbers: Close to a Full Recovery
Total L-1 issuances in FY2025 reached 77,249. That is 7.6% above FY2024 and just 2.6% below the FY2016 baseline, the closest the program has come to its pre-pandemic level in fouryears.
The comparison to pre-pandemic baselines matters for L-1 in a way it does not for O-1, which hit a new record in FY2025. The L-1 program was already leveling off before COVID. FY2016 through FY2019 averaged approximately 77,215 issuances per year, with modest year-over-year variation. The pandemic shock was severe, the recovery has been gradual, and FY2025 lands almost exactly at the long-run average.
Two readings of this:
1- For multinational companies,the program is operating at normal historical capacity. The processing environment in FY2025 is not meaningfully more restrictive than it was before 2020.
2- For India-headquartered companies, which dominate L-1 usage, the volume decline from peak FY2016 levels (-16.2%) reflects structural changes: India-born employees stuck in EB-2 and EB-3 green card backlogs are less likely to pursue L-1A pathways that requireadditional processing steps without a clear permanent residency outcome.
Ten Years of L-1 Data: What the Trend Shows
The decade from FY2016 to FY2025 divides into three clear periods.
From FY2016 to FY2019, the program held a stable band of 74,000 to 80,000 issuances per year. Demand was predictable. India contributed roughly 23,000 to 24,000 cases annually, and the top ten nationality list was largely static.
FY2020 and FY2021 broke thepattern entirely. L-1 issuances dropped to 35,942 in FY2020 and then to 24,863 in FY2021, the lowest point in at least fifteen years. The L-1 visa requires an approved I-129 petition filed by the employer, an interview waiver (or consular appointment), and in many cases physical travel to the United States. All three of those steps were disrupted simultaneously during COVID.
The recovery from FY2022 onward has been consistent. FY2022 jumped back to 72,958. FY2023 reached 76,671. FY2024 pulled back slightly to 71,799, and FY2025 recovered again to 77,249. The program is functionally back to its historical baseline.
L-1 Visa by Country: Who Is Using the Program
Nationality data for the L-1 reveals how differently the program is used compared to the E-2 or O-1. Because L-1 does not require a bilateral investment treaty, any nationality can use it. The distribution is shaped by which countries have the most multinationalcorporate activity with the United States.
India: Dominant but Declining
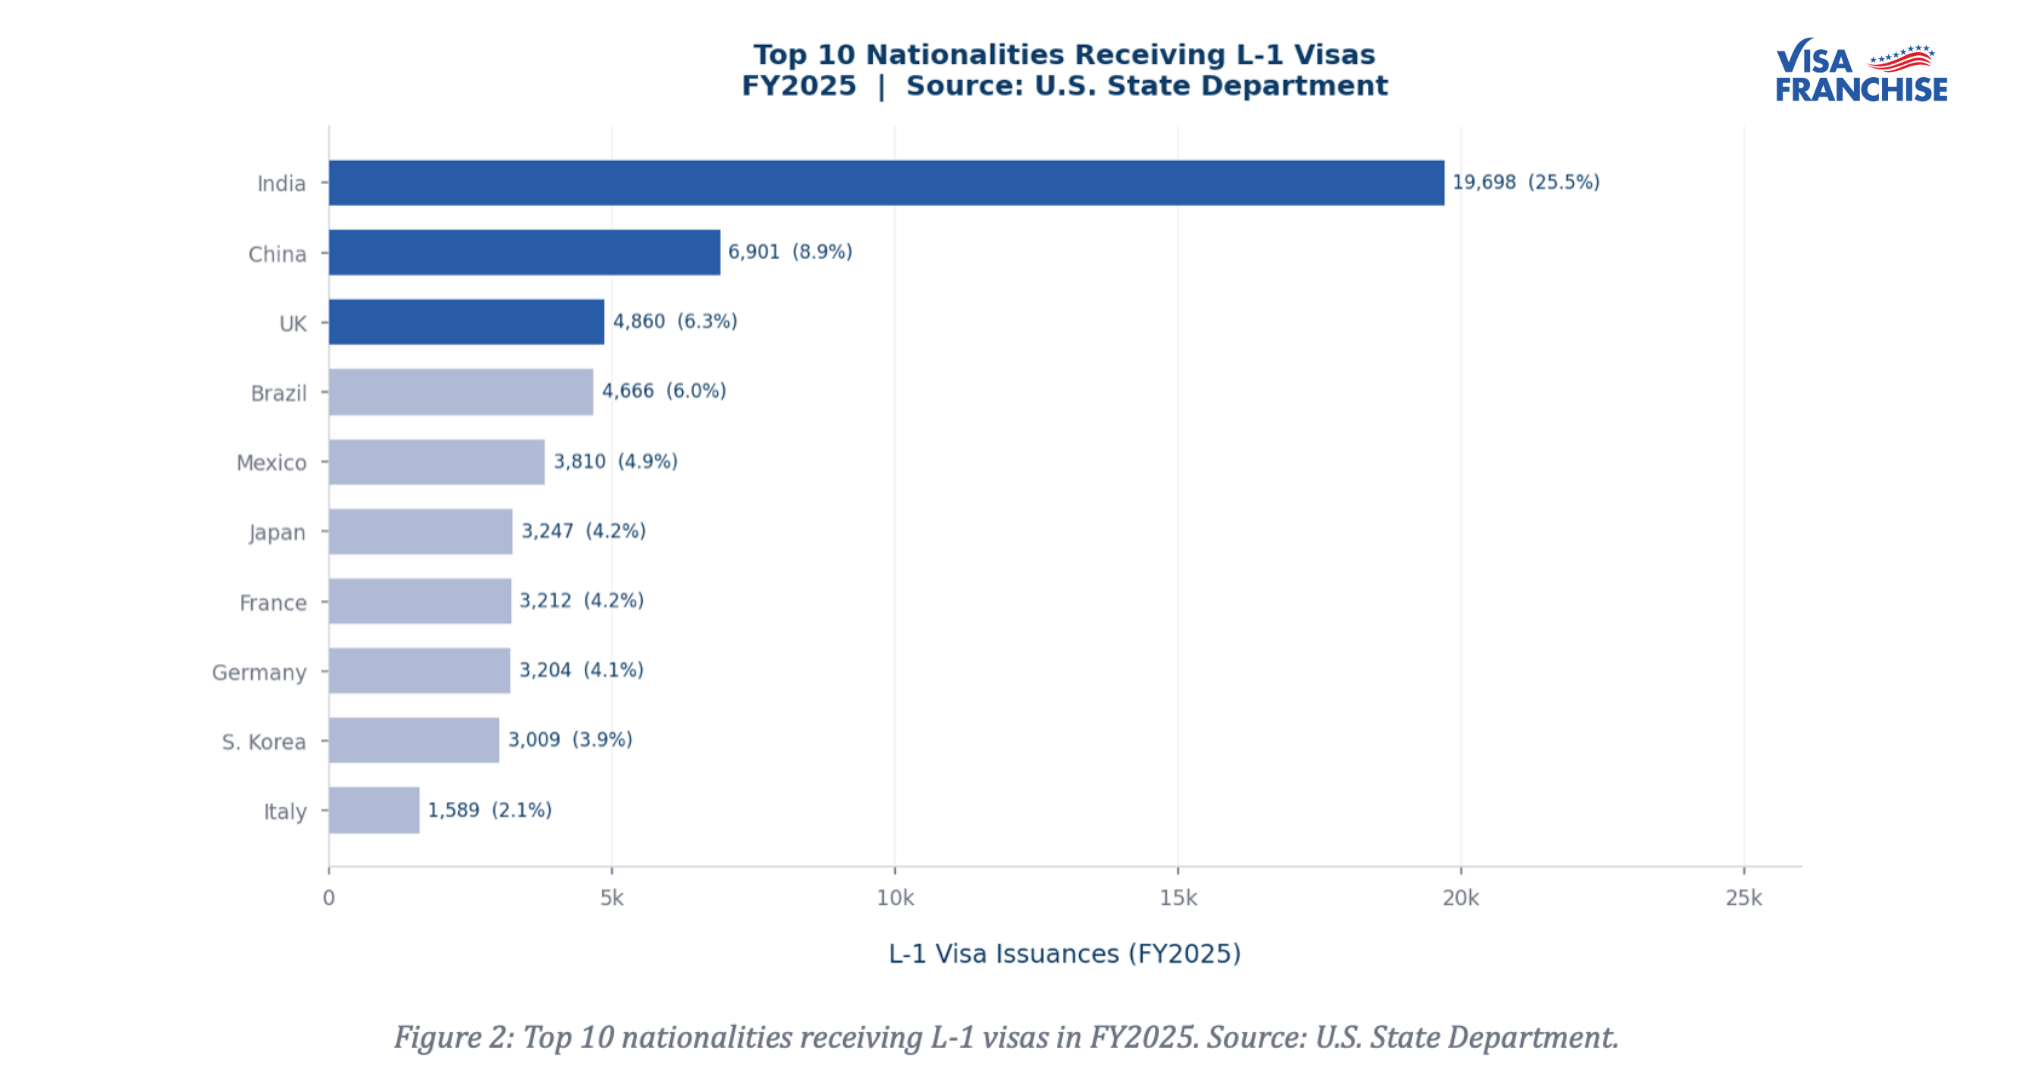
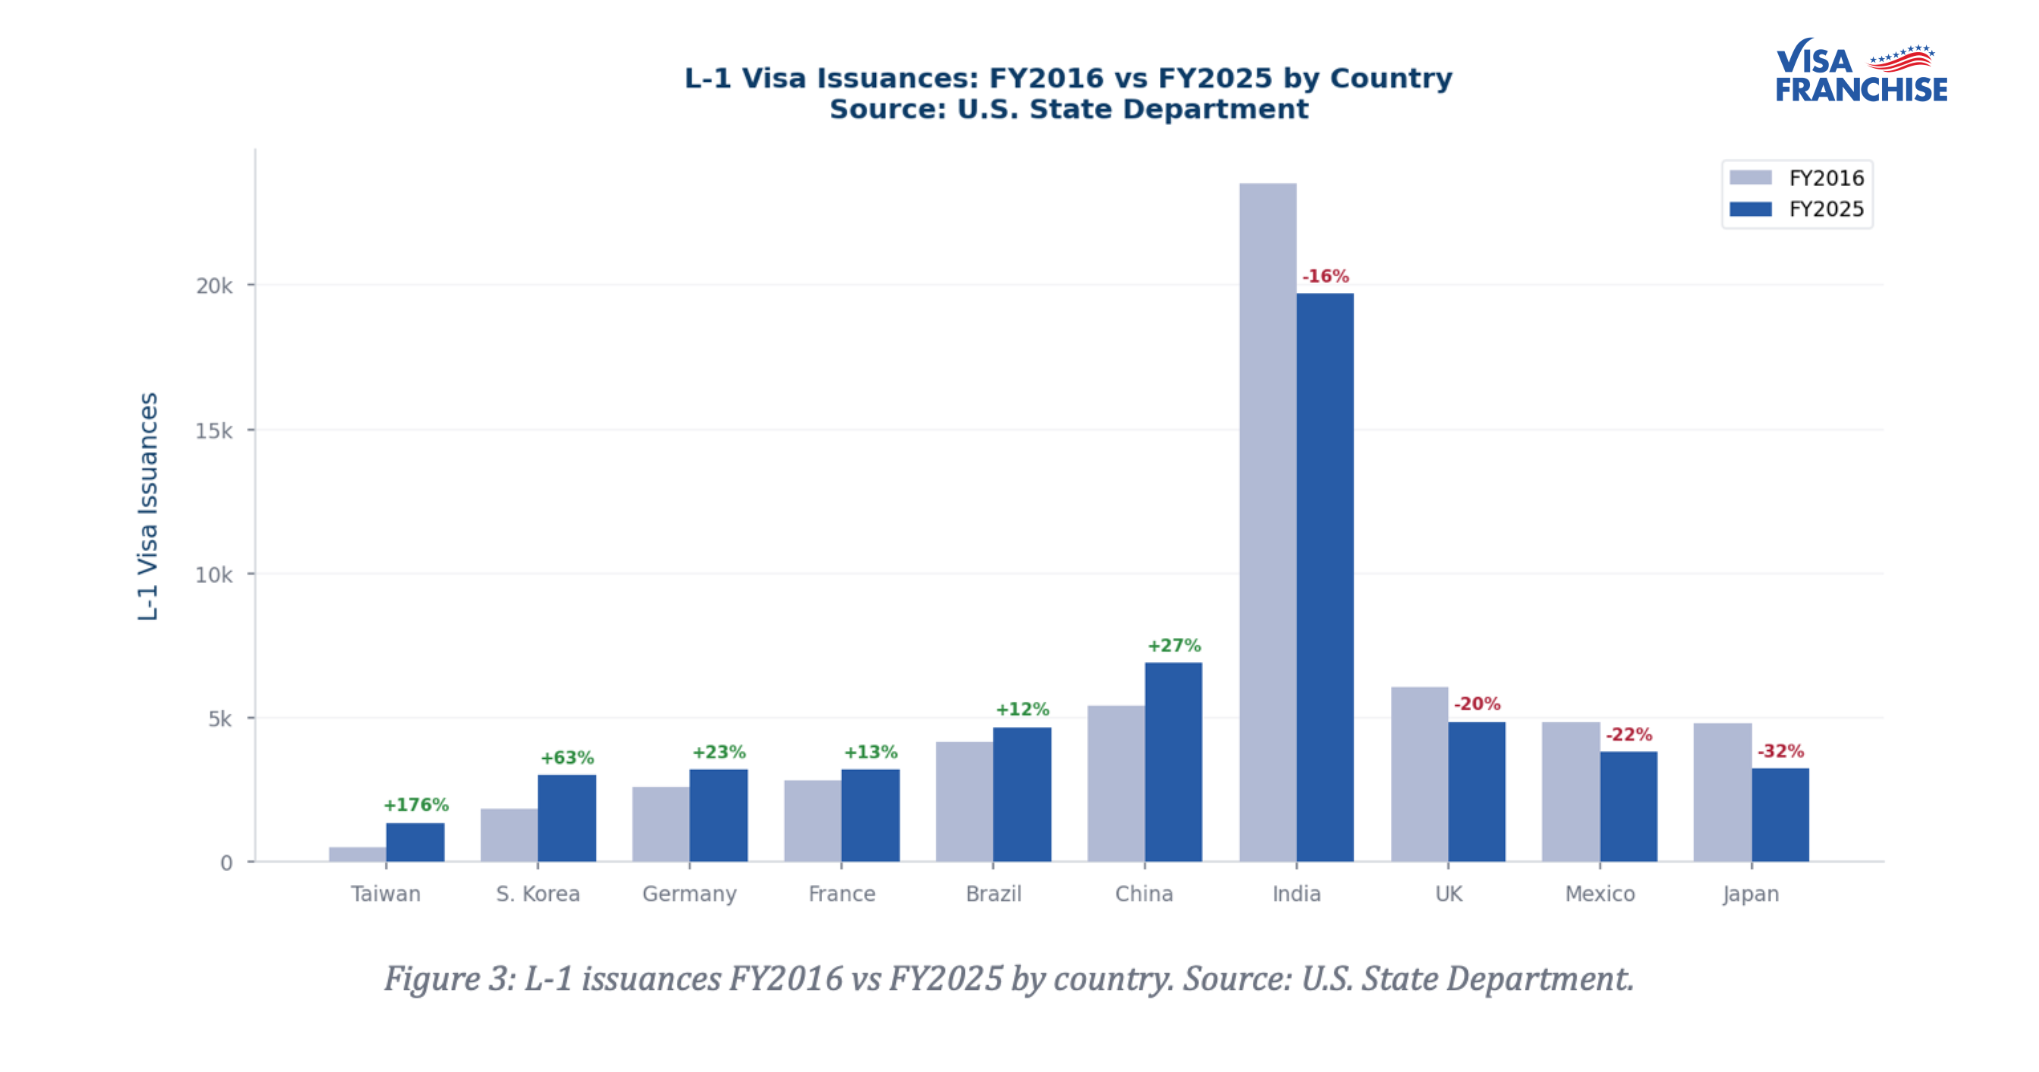
India is by far the largest L-1 nationality at 19,698 issuances in FY2025, representing 25.5% of the entireprogram. No other country comes close. China is second at 6,901, less than 36% of India's total.
Yet India's FY2025 number is 16.2% below its FY2016 level of 23,511. The decline is real and sustained. The most likely explanation is the interplay between L-1 and the employment-basedgreen card system. Indian-born employees face decades-long waits in the EB-2 and EB-3 preference categories due to per-country caps.
For many, initiating an L-1 transfer without a clear path to permanent residency is less attractive than it was a decade ago. The L-1A to EB-1C pathway remains viable for senior executives and managers, but it applies to a narrower group.
Taiwan: The Biggest Growth Story in the Program
Taiwan grew from 490 L-1 issuances in FY2016 to 1,353 in FY2025, a 176.1% increase. That is the largest percentage growth of any country in the dataset and a trend that accelerated sharply from FY2022 onward.
Taiwan's growth tracks the expansion of its semiconductor and technology sector into the United States. Major capital investments by Taiwanese companies in U.S. manufacturing facilities have created a large and growing need for intracompany transfers of specialized knowledge workers and managers. This is exactly the use case the L-1 visa was designed for.
South Korea: Steady Structural Growth
South Korea grew 63.4% over the decade, from 1,841 in FY2016 to 3,009 in FY2025. Korean multinationals across automotive, electronics, and entertainment have expanded their U.S. footprints consistently, and the L-1 issuance trend reflects that.
Japan, UK, and Mexico: Volume Declines
Japan dropped 32.2%, from 4,791 in FY2016 to 3,247 in FY2025. The UK fell 19.8%, from 6,063 to 4,860. Mexico declined 21.5%, from 4,856 to 3,810.
For Japan and the UK, the declines likely reflect a combination of corporate restructuring in the post-pandemic era and the shift toward remote and hybrid work arrangements that reduce the need for physical relocations. Mexico's decline may partially reflect changing patterns in U.S.-Mexico cross-border corporate activity.
China: Steady Growth Against the Trend
China grew 27.1%, from 5,430 in FY2016 to 6,901 in FY2025. Like Taiwan, this growth reflects expanding Chinese corporate investment in U.S. operations and the movement of executives and specialized knowledge workers through the intracompany pathway. China's L-1 usage stands in contrast to its minimal E-2 activity, since China has nobilateral investment treaty with the United States.
Regional Breakdown: Where L-1 Applicants ComeFrom
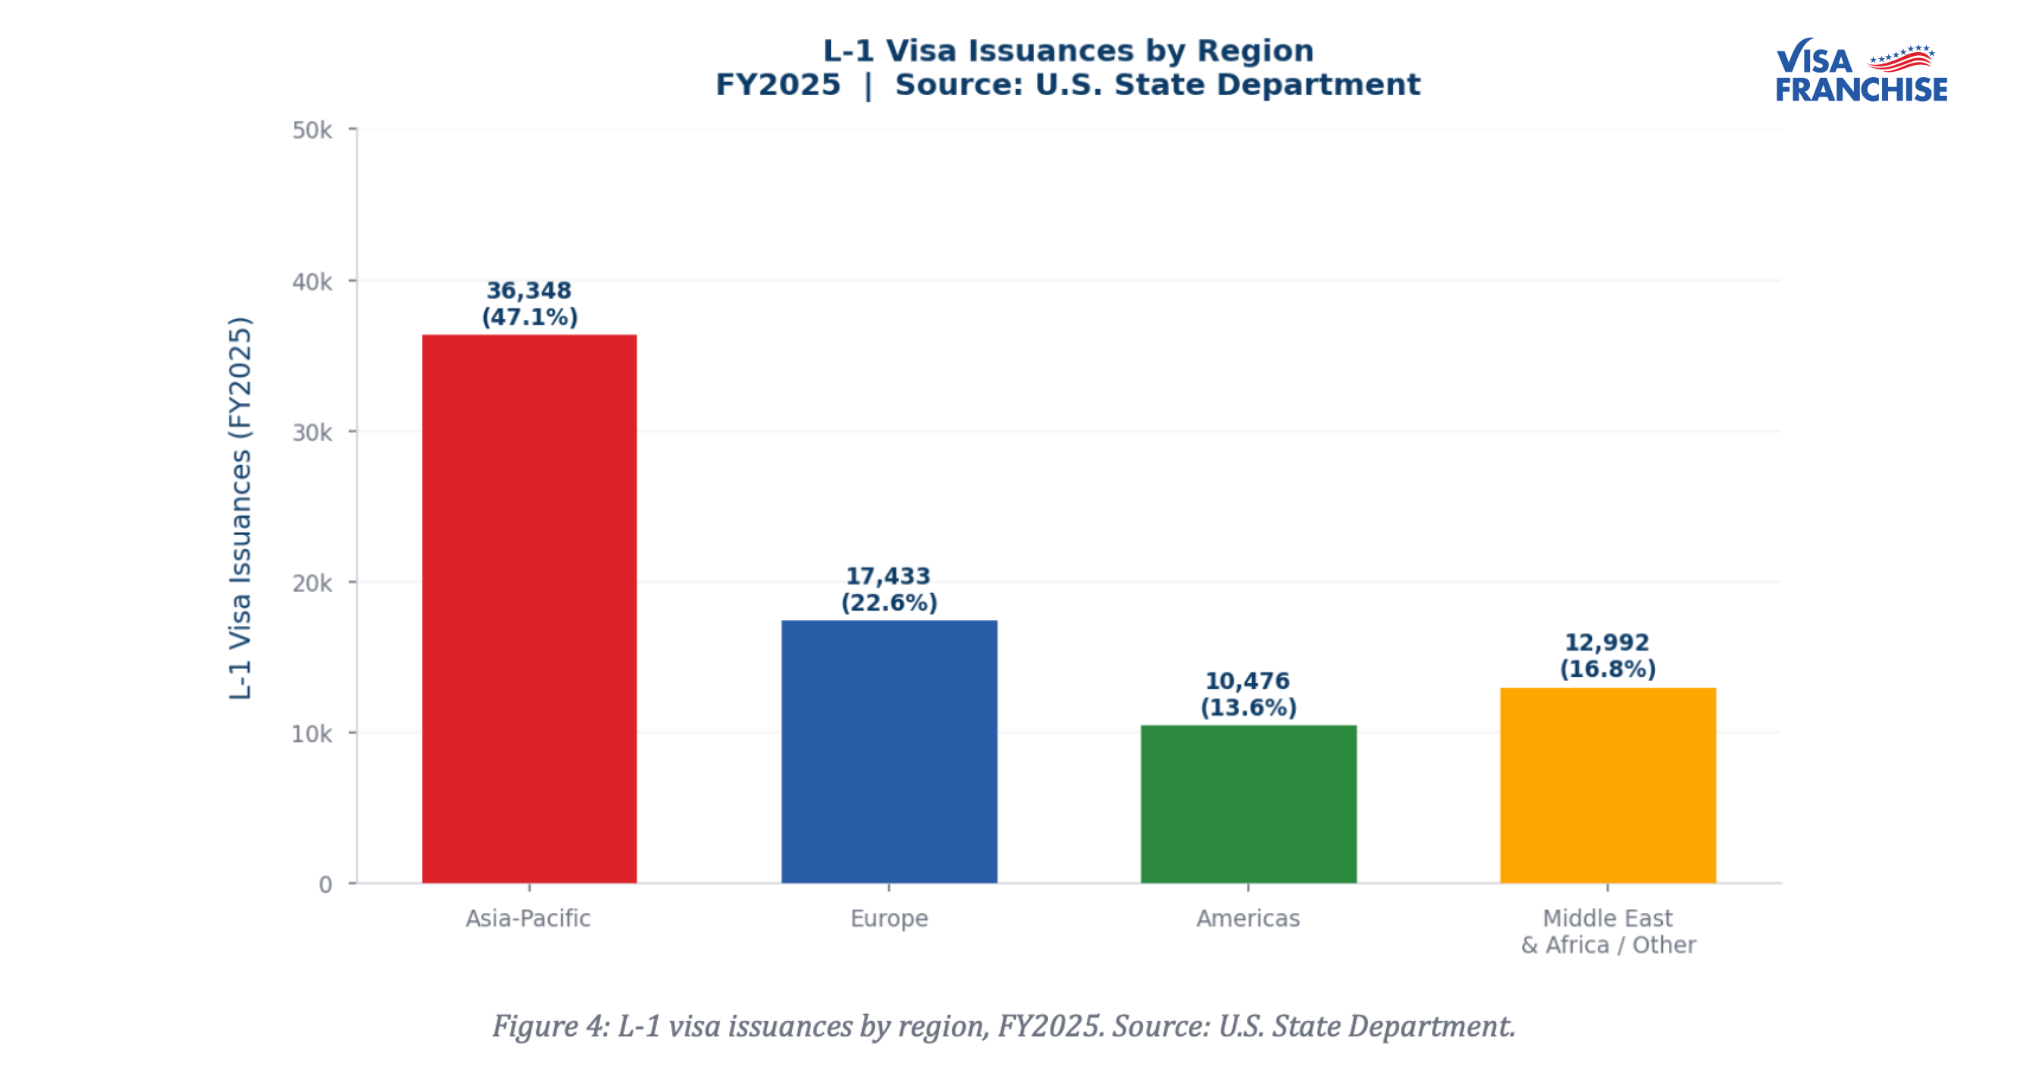
Asia-Pacific is the dominant region for L-1 issuances by a wide margin, driven almost entirely by India. In FY2025, Asia-Pacific nationalities accounted for approximately 47% of total L-1 issuances. Europe is second at roughly 22%, followed by the Americas at around 14%. The Middle East, Africa, and remaining nationalities make up the balance.
This distribution is more concentrated than the O-1 program and reflects the L-1's corporate structure. The multinational companies with the largest U.S. workforces drawing onintracompany transfers are disproportionately headquartered in India, the UK, Germany, Japan, and increasingly Taiwan and South Korea.
L-1A vs L-1B: The Two Categories and What They Require
The L-1 visa divides into two subcategories with different eligibility standards.
L-1A covers intracompanytransferees who work in a managerial or executive capacity. The USCIS definition of "manager" requires that the person manages an organization, department, subdivision, function, or component; supervises and controls the work of other professional employees or manages an essential function; has authority to hire, fire, and recommend personnel actions; and exercises discretion over day-to-day operations.
"Executive" covers those who direct the management of the organization or a major component,establish goals and policies, exercise wide latitude in decision-making, and receive only general supervision from higher-level executives or a board.
L-1B covers intracompany transferees who hold specialized knowledge. USCIS defines specialized knowledge as knowledge of the petitioning organization's product, service, research,equipment, techniques, management, or other interests and its application ininternational markets, or an advanced level of knowledge or expertise in the organization's processes and procedures.
The distinction matters for two reasons. First, L-1A petitions are generally held to a higher standard of evidence but offer a more direct pathway to permanent residency through EB-1C (multinational manager or executive green card). Second, L-1B specialized knowledge cases have faced increasing USCIS scrutiny in recent years, with a notable rise in requests for evidence questioning whether the knowledge is truly specialized versus general industry knowledge.
What Is the L-1 Visa Approval Rate?
The State Department issuance data covers consular approvals, meaning cases where the I-129 petition was already approved by USCIS and the employee then obtained the visa stamp at a U.S. consulate. It does not capture USCIS petition denials or change-of-status approvals.
USCIS publishes petition-level approval data. Historically, L-1 petition approval rates have run above 80% for L-1A cases and somewhat lower for L-1B cases, where the specialized knowledge standard has been applied more restrictively. A 2020 USCIS report on L-1 petitions showed approval rates varying significantly by employer and industry, with large established multinationals seeing higher approval rates than smaller or newer companies.
Common denial reasons for L-1 petitions include:
1- Failure to establish that the employee worked for the qualifying organization abroad for one continuous year within the three years preceding the petition
2- Failure to meet the managerial or executive standard for L-1A (the role is found to be supervisory without genuine authority, or the function managed is not essential)
3- Failure to establish specialized knowledge for L-1B (the knowledge is found to be general industry knowledge rather than specific to the petitioning organization)
4- Failure to establish a qualifying relationship between the U.S. and foreign entities (affiliate,subsidiary, parent, or branch)
L-1 Visa Processing Time in 2026
Standard Processing
L-1 petitions filed on Form I-129 currently run 3 to 6 months under USCIS standard processing. For blanket L-1 petitions (available to large employers who have filed at least ten L-1 petitions in the past year or meet other volume thresholds), the process is faster because individual employees can apply directly at a U.S. consulate without a prior USCIS petition approval.
Premium Processing
Premium processing is availablefor L-1 individual petitions. For an additional fee of $2,805 as of early 2026,USCIS guarantees a decision on the I-129 within 15 business days. Large-volumeemployers and time-sensitive transfers regularly use premium processing. Itdoes not guarantee approval, but it eliminates the uncertainty of multi-monthstandard processing timelines.
Consular Processing
After USCIS approves the I-129, the employee typically applies for the L-1 visa stamp at a U.S. consulate in their home country. Appointment wait times at high-volume posts such as Mumbai, Bangalore, London, and Tokyo currently run 2 to 6 weeks for nonimmigrant visa appointments. The L-1 visa is typically issued for three years on the initial grant (one year for new offices), with extensions of up to two years at a time.
L-1A to EB-1C: The Green Card Pathway
One of the most strategically important features of the L-1A visa is its connection to the EB-1C immigrantvisa category, which covers multinational executives and managers. An employee who has held L-1A status and continues to work in a qualifying managerial or executive role can file an I-140 petition under EB-1C without waiting for a job offer or a PERM labor certification.
EB-1C is current for all nationalities, meaning there is no backlog comparable to the EB-2 and EB-3 queues that affect Indian and Chinese nationals. This makes the L-1A to EB-1C pathway one of the fastest routes to permanent residency for senior executives and managers from any country.
The EB-1C requires that the employee be employed in a managerial or executive capacity at the time the I-140 is filed and that the qualifying relationship between the U.S. and foreign entities still exist. Most L-1A holders who meet these conditions file the I-140 concurrently with or shortly after their L-1A extension.
What This Data Means If You Are Considering an L-1 Transfer
The FY2025 numbers show a program operating at near-normal capacity after four years of recovery. For multinational companies, the practical takeaway is that L-1 processing is functioning predictably again. Premium processing continues to be the most reliable way to manage timelines.
For employees from India, theL-1A to EB-1C pathway deserves specific evaluation. If the role genuinely qualifies as managerial or executive under the USCIS definition, the combination of L-1A status and an EB-1C filing offers a faster route to permanent residency than the EB-2 or EB-3 queues, which currently carry waits of multiple decades for Indian nationals.
For companies in Taiwan, South Korea, and other high-growth markets, the data reflects a real expansion in L-1 usage that tracks corporate investment patterns.
The specialized knowledge standard for L-1B requires careful documentation, particularly for tech and semiconductor roles where USCIS adjudicators have applied heightened scrutinyto claims that knowledge is proprietary rather than widely available in theindustry.
Visa Franchise works with corporate clients and individual executives navigating L-1 petitions alongside broader immigration strategy, including the interaction between nonimmigrantstatus and long-term permanent residency planning.
Frequently Asked Questions
How many L-1 visas are issued each year?
FY2025: 77,249. FY2024: 71,799. FY2023: 76,671. FY2022: 72,958. The decade average (FY2016 to FY2025) is approximately 66,836 issuances per year, though that average is pulled down by the COVID years of FY2020 (35,942) and FY2021 (24,863). The pre-pandemicaverage from FY2016 to FY2019 was approximately 77,215 per year.
Which country receives the most L-1 visas?
India leads by a wide margin.In FY2025, India received 19,698 L-1 visas, representing 25.5% of the total program. China is second at 6,901 (8.9%), followed by the UK at 4,860 (6.3%). India has led L-1 issuances in every year of the dataset, though its share has declined from a peak of roughly 30% in FY2016.
What is the L-1 visa approval rate?
USCIS does not publish a single annual approval rate for L-1 petitions. Historical USCIS data shows L-1A petition approval rates above 80% for most established multinationals.
L-1B approvals have run lower in recent years due to heightened scrutiny on specialized knowledge claims. The consular approval rate, after USCIS petition approval, ishigh because the qualifying standard has already been adjudicated.
What is the difference between L-1A and L-1B?
L-1A is for managers andexecutives. It requires that the person manage an organization, department, oressential function and exercise significant discretion over day-to-dayoperations.
L-1B is for employees with specialized knowledge of the company's products,services, processes, or procedures. L-1A carries a direct pathway to the EB-1Cgreen card category, which is current for all nationalities and requires nolabor certification. L-1B does not have an equivalent direct green cardpathway.
How long does L-1 visa processing take in 2026?
Standard USCIS processing for Form I-129 L-1 petitions runs 3 to 6 months. Premium processing, available for an additional fee, guarantees a USCIS decision within 15 business days.
After USCIS approval, consular appointments at major posts typically run 2 to 6 weeks. Total timeline from petition filing to visa issuance is typically 4 to 8 months without premium processing, or 6 to 10 weeks with it.
Can the L-1 visa lead to a green card?
Yes, through two pathways. L-1A holders can pursue EB-1C (multinational manager or executive), which requires no labor certification and is currently visa-number current for all nationalities.
L-1B holders can pursue EB-2 or EB-3 through the standard PERM labor certification process, though Indian and Chinese nationals face significant wait times in those categories. The L-1A to EB-1C route is the more practical path for senior executives and managers.
Why is India's L-1 usage declining even as theprogram recovers?
India's L-1 issuances fell 16.2% from FY2016 to FY2025, despite the overall program recovering close toits pre-pandemic level. The most widely cited explanation is the interaction between L-1 and the employment-based green card system. Indian nationals face decades-long backlogs in the EB-2 and EB-3 categories due to per-country caps.
For employees who cannot pursue the L-1A to EB-1C pathway (because the roledoes not qualify as managerial or executive), initiating an L-1 transfer offers temporary work authorization without a clear permanent residency outcome. Some of these employees and their employers have shifted to H-1B or other strategies instead.
Discover if you qualify to invest in a thriving U.S. franchise and secure your E-2 visa.
Check your eligibility
More Insights You Might Like
Explore related articles packed with expert advice, real stories, and practical tips to support your U.S. visa and relocation journey.


