Corporate Caterers
1. Franchise Snapshot
Why this franchise?
- This is some text inside of a div block.
- This is some text inside of a div block.
- This is some text inside of a div block.
Franchise Status
Basic Information
Video
In these videos you will learn about the company firsthand. And they will also tell you in a short form about the financing of the enterprise.
2. Franchise Overview
Overview
For over 25 years, they have delivered the freshest, most delicious meals to offices across the country, providing generous portions of breakfast and lunch dishes that make them America's favorite office caterer. Their menu, featuring a wide selection of classic and new flavors, is matched by exceptional service for groups of 10 or more. Sharing a meal channels energy, restores human connection, nurtures dialogue, and offers comfort—commitments they uphold as the silent partner who sets the table for these shared experiences. Their proven business model, established over two decades, stands out in the QSR industry. They offer a competitive advantage with a unique selling proposition and a lower cost of entry. Their franchise model ensures work/life balance, requiring minimal culinary skills, and protects exclusive market territories from saturation. Engaged and invested in franchisee success, they provide comprehensive support with operating systems, proprietary software, training, resources, and marketing. The demand for their catering service is sustainable and growing, offering significant opportunities with just one location and a one-time investment.
Management team / founders
In 1997, after years of experiencing the pressures of running large restaurants, Jim Gass recognized an opportunity to establish a different kind of catering company: Corporate Caterers. Over 20 years and millions of dollars in sales later, Jim still plays an instrumental role as the Founder. He guides clients through the process, holding their hands every step of the way. This unique opportunity to be trained by the founder of a successful concept is just one more reason why Corporate Caterers is such a great opportunity. Greg Halton, President and CEO, is a natural entrepreneur and business leader who has successfully transformed multiple family-run companies into efficient, professionalized businesses. He applies his extensive leadership experience to accelerate the growth of the brand by overseeing finance, operations, technology, and marketing. Greg’s influence is evident in almost everything they do. He ensures that while the company remains small, its vision is large, and its operations align with some of the most successful large-scale concepts out there. As Greg likes to say: We provide our franchisees with the same support and systems as the large QSR concepts – the difference is, we do it personally.
Focus of owner for daily business operations
As a Corporate Caterers operator, the main facets of the business entail: 1. Hiring and managing of store staff; 2. Establishing and overseeing operations; 3. Local marketing efforts within the community; 4. Review of financials
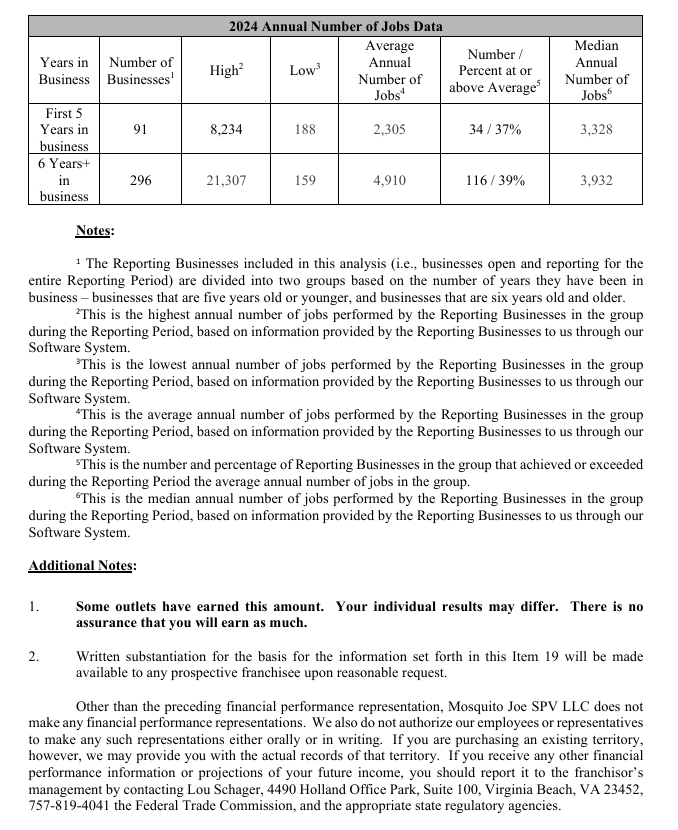
3. Performance & Metrics
Franchisor Fees | Item 6
Total Investment Cost | Item 7
Outlets and Franchisee Information | Item 20
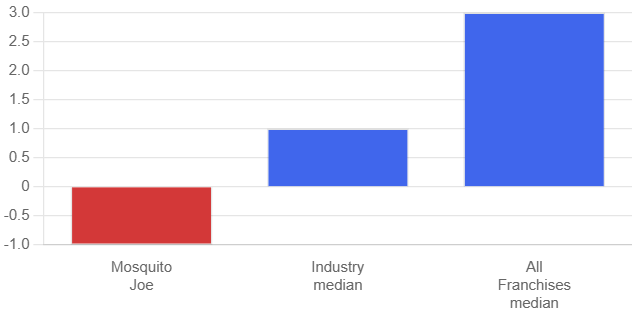
Franchise Health Metrics
1 year / 3 years
1 year / 3 years
1 year / 3 years
Franchise Health Metrics