MaidPro
1. Franchise Snapshot
Why this franchise?
- This is some text inside of a div block.
- This is some text inside of a div block.
- This is some text inside of a div block.
Franchise Status
Basic Information
Video
In these videos you will learn about the company firsthand. And they will also tell you in a short form about the financing of the enterprise.
2. Franchise Overview
Overview
MaidPro is as passionate about cleaning and saving customers money while we do it! That’s why they offer budget-friendly, fully customizable cleaning plans. Because of this, clients never pay for what they don’t need. t MaidPro, they customize their service to meet the client's needs and budget. They offer a full range of house cleaning services and use a 49-Point Checklist to guarantee the client's home is cleaned correctly every time. Kitchens, bathrooms, floors, and dusting are their specialties.
Management team / founders
MaidPro, a home cleaning concept under the multi-brand home services franchisor Threshold Brands, was established in 1996 and began franchising in 1997. Over the course of the past 20-plus years, the concept has continued to grow in markets across the nation, bringing the Pros of MaidPro into the homes of busy families.
Focus of owner for daily business operations
As a MaidPro operator, the main facets of the business entail: 1. Manage day-to-day bookings; 2. Interacting with clients and being the face of the company; 3. Hiring and managing staff; 4. Marketing and advertising locally; 5. Making sure safety standards and protocols are being met
3. Performance & Metrics
Franchisor Fees | Item 6
Total Investment Cost | Item 7
Outlets and Franchisee Information | Item 20
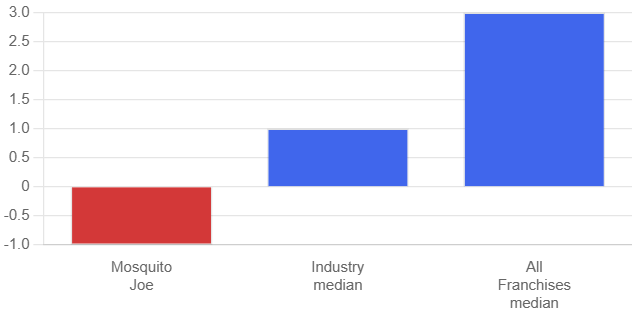
Franchise Health Metrics
1 year / 3 years
1 year / 3 years
1 year / 3 years
Franchise Health Metrics