

Mathnasium
1. Franchise Snapshot
Franchise Status
Basic Information
Video
In these videos you will learn about the company firsthand. And they will also tell you in a short form about the financing of the enterprise.
2. Franchise Overview
Overview
Mathnasium is a top-rated math education franchise specializing in personalized tutoring for K-12 students. They have been in the market for over 20 years and provide students with tailored learning plans using the proprietary Mathnasium Method™, designed to build deep mathematical understanding and confidence. Mathnasium has developed a strong presence with over 1,100 learning centers in 10 countries, giving owners an edge in the rapidly growing tutoring industry. In addition, they provide comprehensive support including site selection, marketing strategies, personalized coaching, and ongoing training, making it accessible for entrepreneurs from all backgrounds, with no math expertise required.
Management team / founders
In 2002, education industry pioneers Peter Markovitz and David Ullendorff, along with beloved educator and curriculum consultant Larry Martinek, opened the first Mathnasium Learning Center in Los Angeles. Larry Martinek, who devoted over 35 years to finding better ways to teach math, created the proprietary Mathnasium Method™ and continues to serve as Principal Education Advisor. The company began franchising in 2003 and has since grown to over 1,100 centers worldwide. Today, Tyler Sgro serves as CEO, bringing extensive experience in finance, systems, and M&A. Kevin Shen serves as Chief Financial Officer, having previously led franchise development at Jackson Hewitt Tax Service, and Kristin Goedke serves as Chief Franchise Operations Officer, with prior leadership roles at Papa John's and Aspen Dental. With operations across 10 countries, Mathnasium is dedicated to the continued success of franchisees. Franchise owners are supported from day one with a Start-Up Specialist, and receive ongoing guidance from dedicated Franchise Business Consultants who visit learning centers regularly.
Focus of owner for daily business operations
As a Mathnasium franchise operator, the main facets of the business entail: 1. Managing your instructors and center staff to ensure quality delivery of the Mathnasium Method™; 2. Attracting and retaining students through parent engagement and community outreach; 3. Conducting local marketing efforts to build brand awareness and drive enrollment; 4. Review of financials, student progress metrics, and enrollment growth.
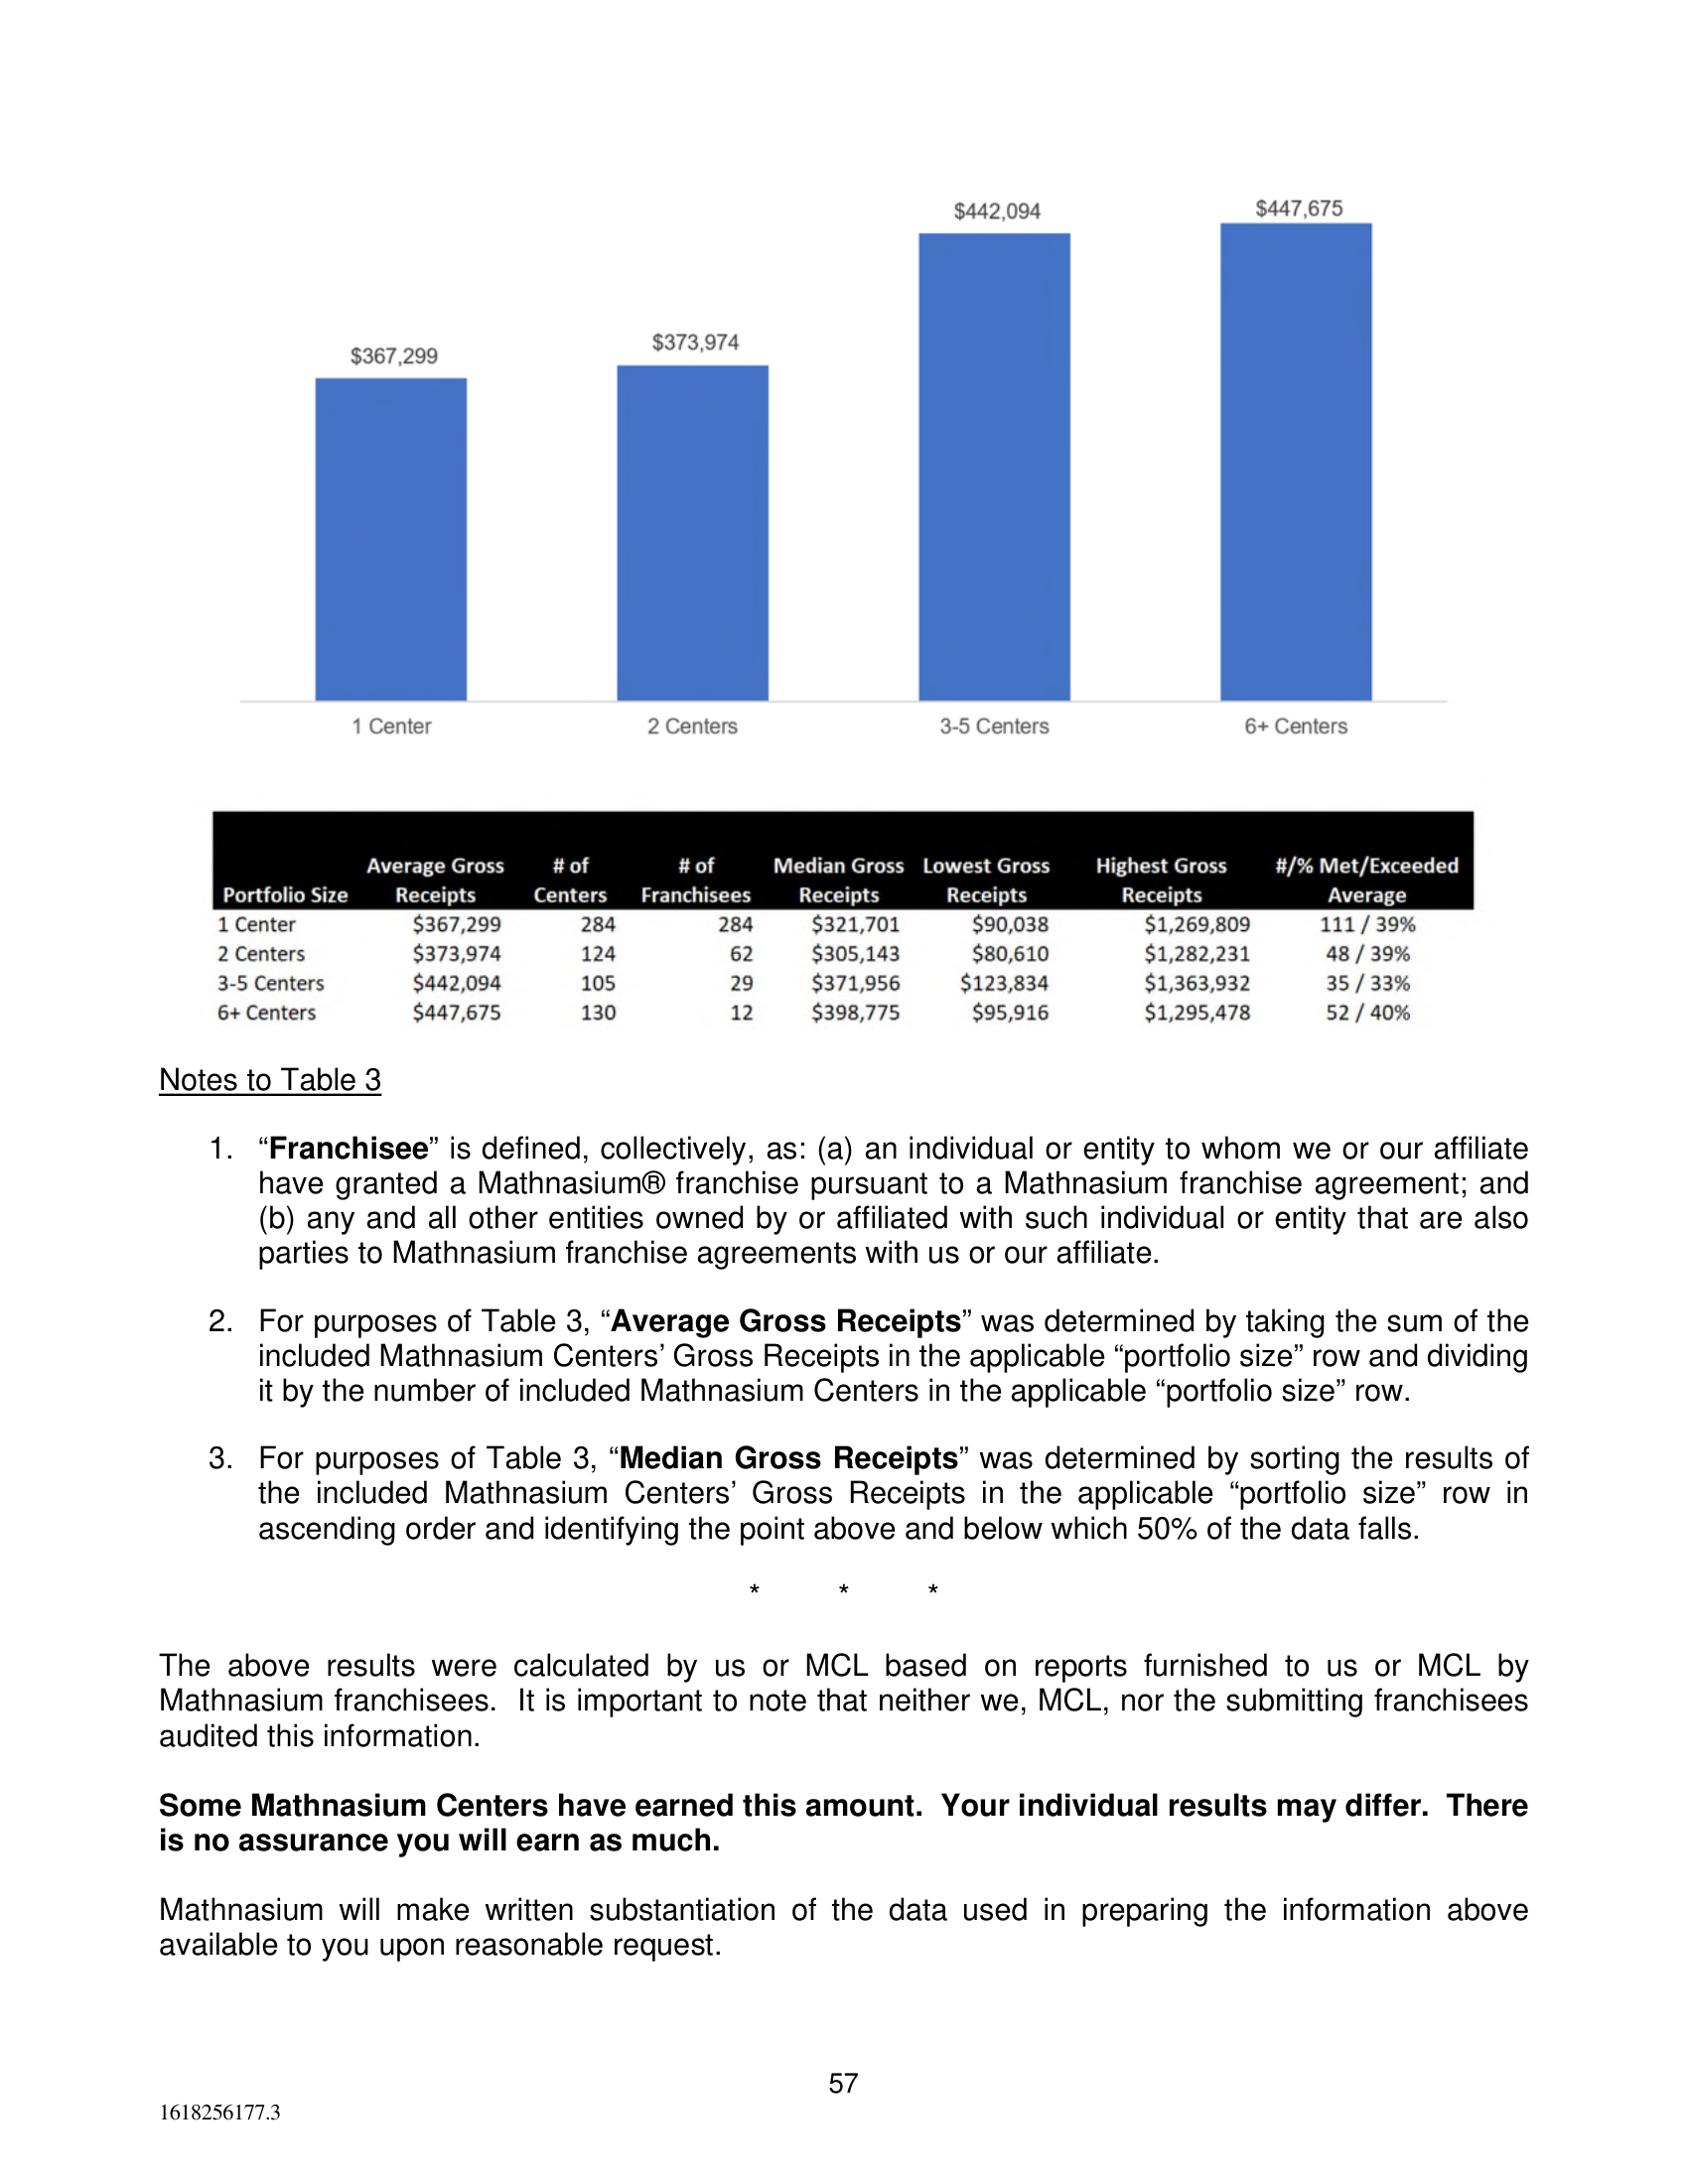
3. Performance & Metrics
Franchisor Fees | Item 6
Total Investment Cost | Item 7
Outlets and Franchisee Information | Item 20
Franchise Health Metrics
1 year / 3 years
1 year / 3 years
1 year / 3 years
Franchise Health Metrics